
Your child’s homework asks for a tape diagram, and you have two choices. One, show them the arithmetic the way you learned it. Two, draw the bar the worksheet is asking for. Draw the bar. It is a rectangle, drawn like a strip of tape and split into labeled segments, that describes how the quantities in a word problem relate to each other. Students partition and label the bar first, and then write the equation from the diagram.
What is a tape diagram in math?
A tape diagram is one or more rectangles split into segments. Each segment represents a quantity, known or unknown, in the given situation. The whole bar stands for the total. The length of a segment carries the meaning. For example, a longer segment means a bigger quantity. You do not count individual items.
The bar looks like a strip of masking tape, or a piece of measuring tape laid flat on the paper, so the name is pretty literal.
What every part of the bar represents
Every part of the bar has a specific meaning. A tape diagram is always correct if it contains the following five things:
- A bar (or two bars if the problem is about comparison).
- Partition lines separating the parts.
- Labels for each segment with units — “7 red apples,” not a bare “7.”
- A label or bracket for the total.
- A question mark for the unknown.
A first labeled example, read left to right
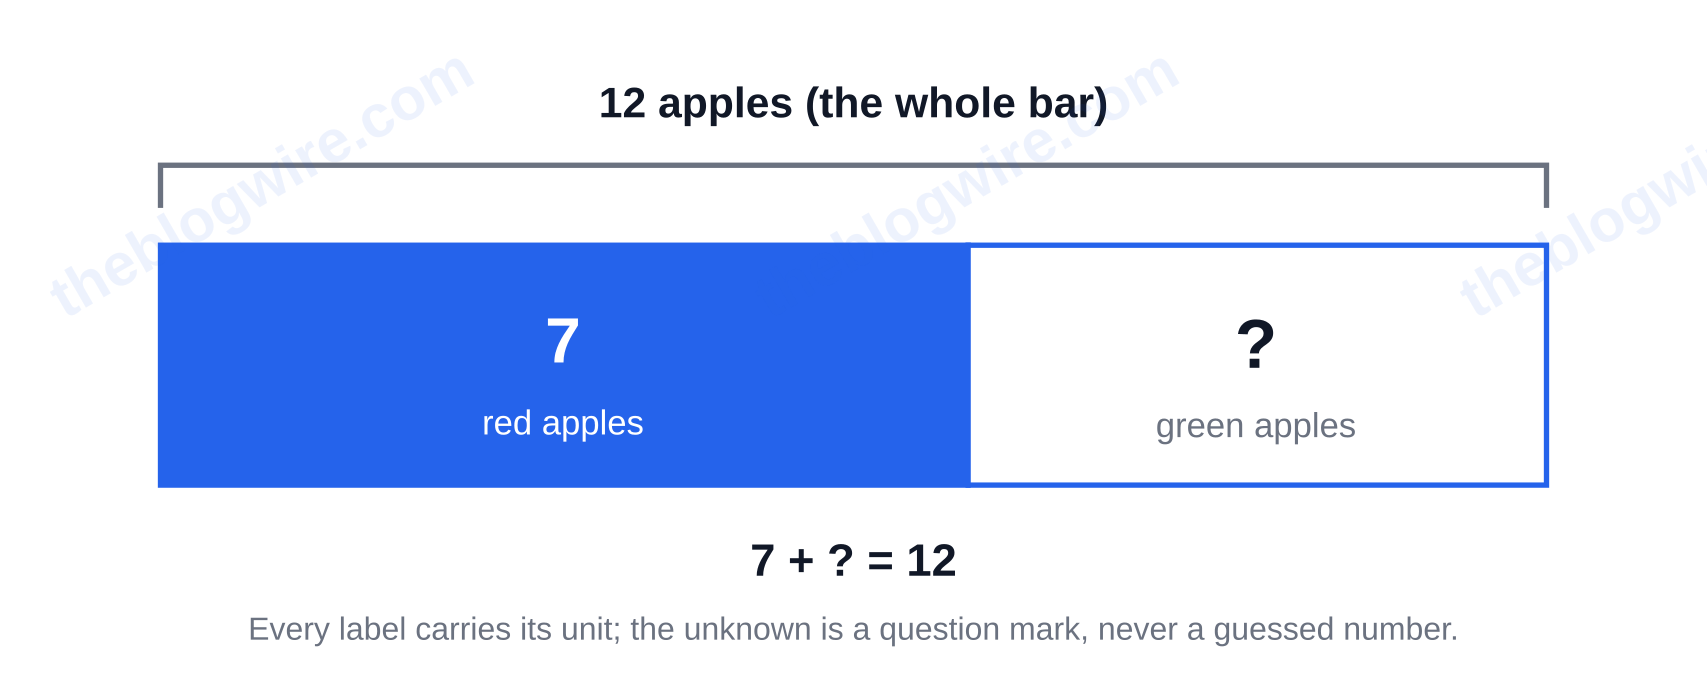
There are 12 apples in a bowl. Seven are red. How many are green?
Start with one rectangle. Cut it into two parts. Write “7 red” in the left part and “?” in the right part. Bracket the whole bar and write “12 apples” outside the brackets. Now the picture shows 7 + ? = 12, without you having to decide whether “how many are green” means add or subtract. That’s the hard part of a word problem. The bar does that for you.
What is it not? It’s not a number line, not a picture of apples, and not a sketch you’d measure with a ruler.
As for where the public record stands, Wikipedia’s article on the tape diagram is flagged as a stub and relies on a single source, Watts-Lawton and Sheeron’s Eureka Math Curriculum Guide: A Story of Units, Grade 2 (Wiley, 2015). Because of that, the fuller standards-linked picture is hard to find in one place.
Is a tape diagram the same thing as a strip diagram or a bar model?
Yes, same tool, different terminology. The part-part-whole thinking behind it doesn’t change.
“Tape diagram” is the term used in the Common Core and Eureka Math standards. In Texas, it is called a “strip diagram” because that is the term used in the Texas Essential Knowledge and Skills (TEKS). Bar models are from the Singapore math bar modelling strand, the heritage the US version was adapted from. Other terms Wikipedia lists, which you might run into on a worksheet, are divided bar model, fraction strip, and length model.
This matters more than it appears. Parents who search the exact words on the worksheet often find alternate instructions written under a different name, and assume it is a different method requiring a different approach. It isn’t.
One other diagram that is genuinely different is the double number line diagram. It sits alongside tape diagrams in the grade 6 ratio standards. In this case, you read quantities from a line instead of from partitioned boxes.
Which tape diagram fits which problem — and which standard asks for it
This is the piece most explainers skip. Each structure matches a problem type, and each problem type connects to a named grade or standard. Identify the problem type first, and the structure follows — never the reverse.
The diagram-type to standard crosswalk
| Diagram type | Problem type it fits | Where it shows up |
|---|---|---|
| Part-whole bar (one bar split into parts) | Join and separate; addition and subtraction | Grades 1–2 |
| Comparison bar / double tape diagram (two bars aligned at the left) | How many more, how many fewer | Grades 2–4 |
| Equal-groups bar (one bar split into same-sized sections) | Multiplication and division | Grade 3 onward |
| Fraction bar (whole partitioned into equal unit fractions) | Fractions of a whole; division with fractions | Grades 4–5 |
| Ratio double bar (boxes are units, not item counts) | Ratio and rate reasoning | 6.RP.A.3, which names the model explicitly alongside tables of equivalent ratios and double number line diagrams |
| Unknown-value bar (a known amount plus several copies of an unknown) | Equations of the form px + q = r and p(x + q) = r | 7.EE.B.4.A, taught in Illustrative Mathematics Grade 7, Unit 6 and in Fishtank Learning’s grade 7 equations lessons |
How to pick the structure before you draw
First ask one question of the problem: does it involve combining, comparing, or grouping? Combining is splitting a bar into parts. Comparing is aligning two bars at the left edge. Grouping is dividing a bar into equal, same-sized sections. This is where parents usually get stuck: drawing a part-whole bar for a comparing problem.
One caveat on freshness: the canonical US teacher handout for this model is hosted by the Louisiana Department of Education, and it is dated July 2014, with no substantial re-issue since then. It’s best to read it for the curriculum’s stated intent rather than as a statement of current best practice.
How do you draw a tape diagram step by step?
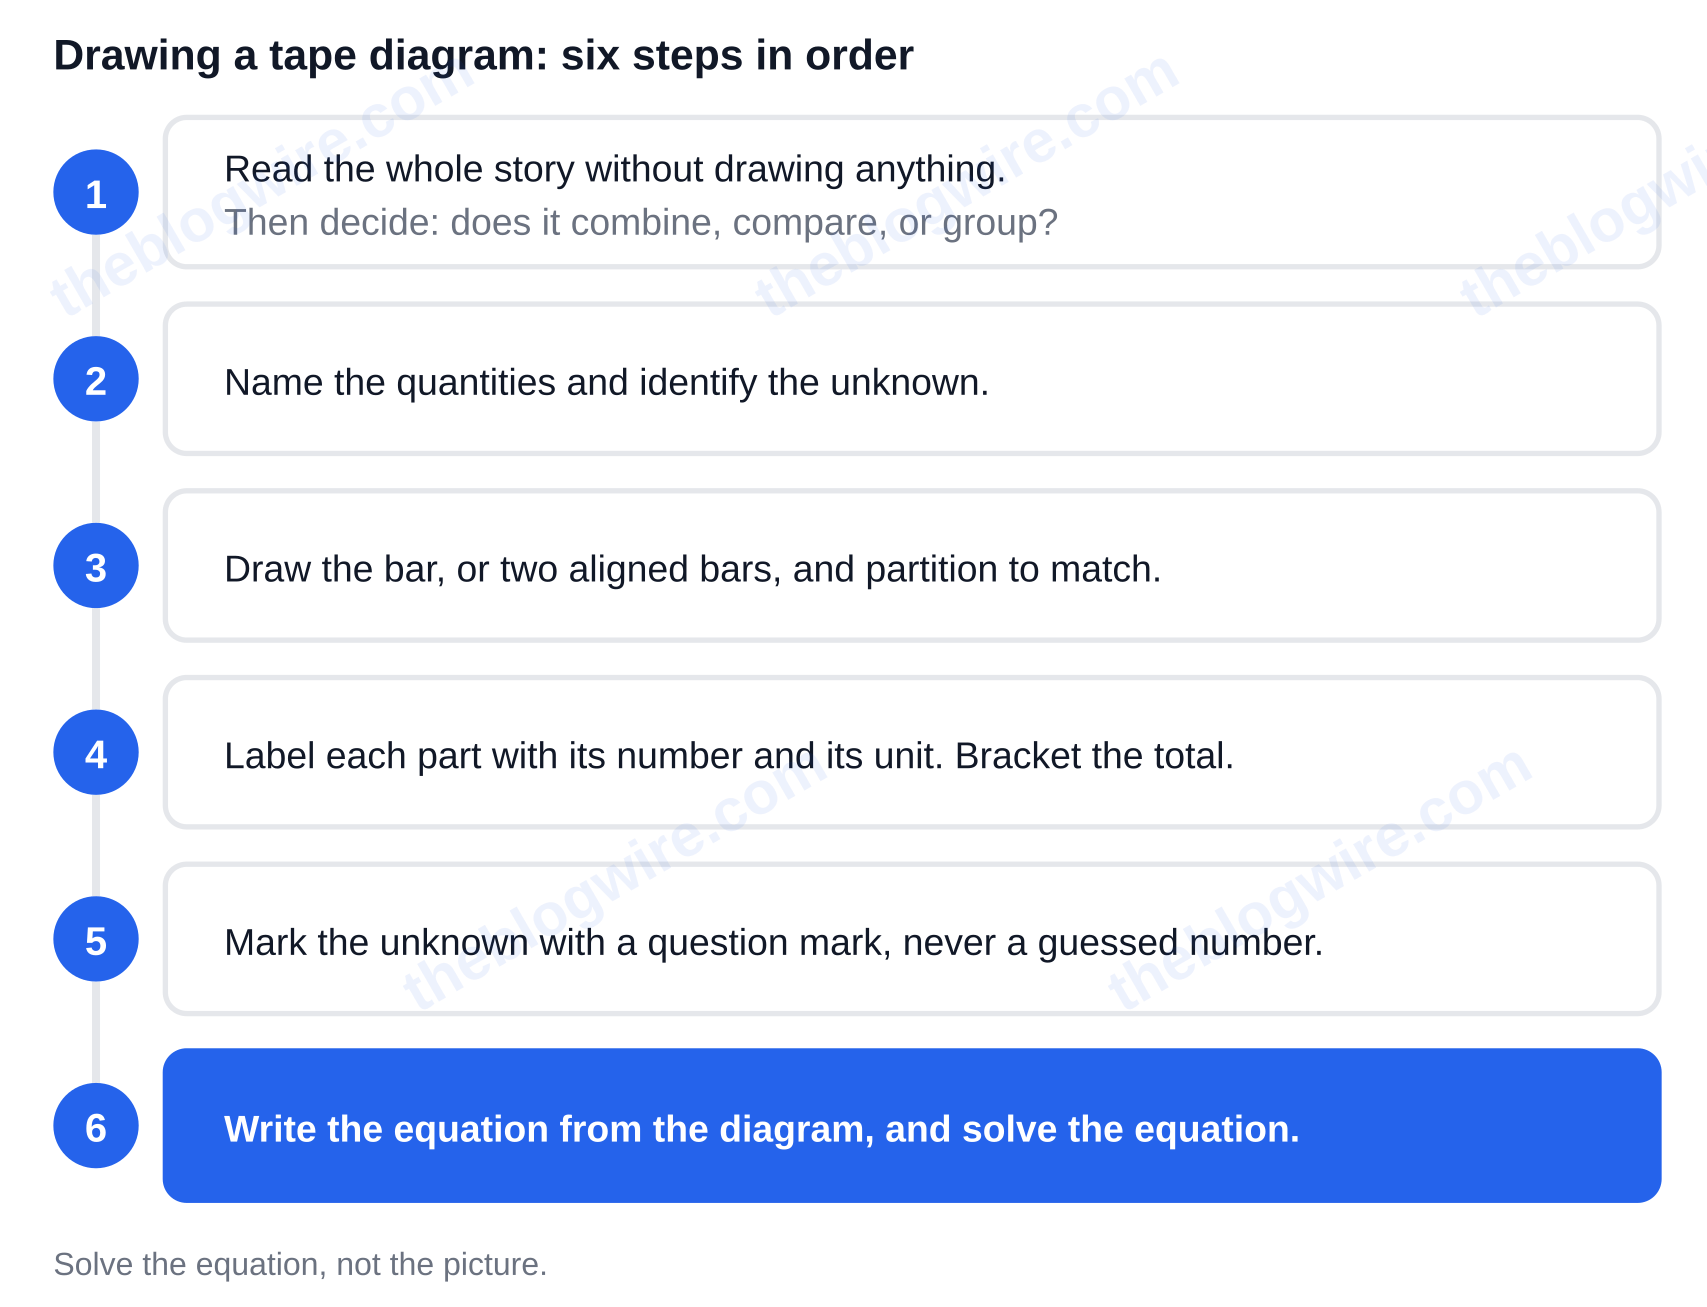
The six drawing steps
- Read the whole story without drawing anything. Then decide if the story combines, compares, or groups quantities.
- Name the quantities and identify the unknown.
- Draw the bar, or two aligned bars, and partition to match that structure.
- Label each part with its number and its unit. Bracket the total.
- Mark the unknown part with a question mark, never with a guessed number.
- Write the equation from the diagram and solve the equation rather than the picture.
Do tape diagrams have to be drawn to scale?
No, and this is where most definition pages leave parents stuck with the explanation, “The sizes of the bars match the amounts they represent.” That sounds like an instruction to measure. It isn’t one. Three checkable tests replace it:
- Equal parts must look visibly equal.
- A greater quantity must look visibly longer than a lesser quantity.
- Proportionality need not be exact.
So a 3:2 bar needs three boxes the same size as each other and two boxes the same size as each other. No ruler.
What the diagram looks like for each operation
One model, several shapes:
- Addition and subtraction: one part-whole bar, with the unknown sitting in a part or in the whole depending on the story.
- Comparison subtraction: two aligned bars, with the difference showing as an overhang on the longer bar.
- Multiplication: an equal-groups bar, with the same value repeated in each section.
- Division: the same bar, where either the size of each group or the number of groups is unknown.
- Fractions: a whole bar, partitioned into equal unit fractions, including division with fractions in grade 5.
- Ratios: Example from Wikipedia: a boy has won 15 games at a win-to-loss ratio of 3:2. Fifteen wins across three boxes makes one box worth 5, so the two loss boxes give 10 losses.
- Percents: a bar, partitioned into ten or a hundred parts, with the whole labeled 100%, so the part and the percent sit on one picture.
- Equations with an unknown: a known value with several identical unknown boxes. That is the bridge to algebra in grade 7.
Why teachers use the bar instead of just the equation
The reason is that the diagram captures the relationship, and the student cannot simply operate on keywords like “altogether” or “left” and guess the operation. Keyword-hunting works until a problem is written to defeat it.
Great Minds’ Eureka Math blog describes the model as a pictorial representation students draw of a mathematical relationship, and traces it from grade 1 addition to grade 2 equal groups, to grade 5 division with fractions, to grade 7 unknowns, and to Algebra I multi-step problems. One model. One progression. The bar is the middle step between counting physical objects and working with symbols.
What grade do students learn tape diagrams?
Grade 1, in the simplest form of part-whole relationships, and it repeats through Algebra I. Students meeting it for the first time in a grade 6 ratio lesson are meeting it late relative to Eureka’s sequence — not wrongly, just later. In fact, Eureka’s own advice to teachers is to introduce the model in a dedicated lesson using easy problems, so the students’ attention is on the diagram and not on new content. The same trick works at the kitchen table.
When does the bar stop helping?
Few explainers tell you when to retire the model, so here is the rule: the bar is meant to help find a relationship. When a student can write the equation straight from the story, the bar has done its job and should be replaced by the equation — not drawn out of obligation.
The bar stops helping in two situations in particular. The first is when there are two unknowns that cannot both be read off a single bar. The second is when the relationship is not additive or multiplicative in a way a length can show.
The one-box-equals-one-thing mistake
One learner is left behind by the standard advice: the student who reads one box as one object. On a ratio diagram, one box is a unit worth 5 or 50, not one object. For that student, “just draw the bar and read off the answer” is wrong advice.
The solution is procedural. Write the value of one box in or under the box before computing anything. Then the diagram carries the unit value instead of an implied count of one. Other recurring breakdowns are easier to spot: unequal parts drawn as equal, missing unit labels, and comparison bars that are not aligned at their left edges.
How parents can help with tape-diagram homework
Do not reteach it the old way. Ask two questions instead. What does one box represent? What does the whole bar represent? If your child can answer both of these questions, the arithmetic takes care of itself. If they can’t, you have found the actual problem.
The three things worth remembering
First, this is a relationship diagram, not a drawing exercise — so partition the bar to match the problem type, label every part with its unit, and state the value of one box. Second, the crosswalk above tells you which structure your grade actually calls for, whether it be part-whole bars in grade 1 or unknown-value bars at 7.EE.B.4.A. Third, take the word problem in front of you right now, decide whether it combines, compares, or groups, draw only that structure, and check it against the three scale tests before you solve. Browse more explainers on The Blog Wire for related reads.